
Learn how to have always up-to-date environment statuses in Golive
Why should you track your Environment Statuses in Golive?
Because Golive is really good at sharing status information with the relevant people.
You can easily browse the status change logs of your environments from the different types of environment views, issue page and environment details right in Jira.
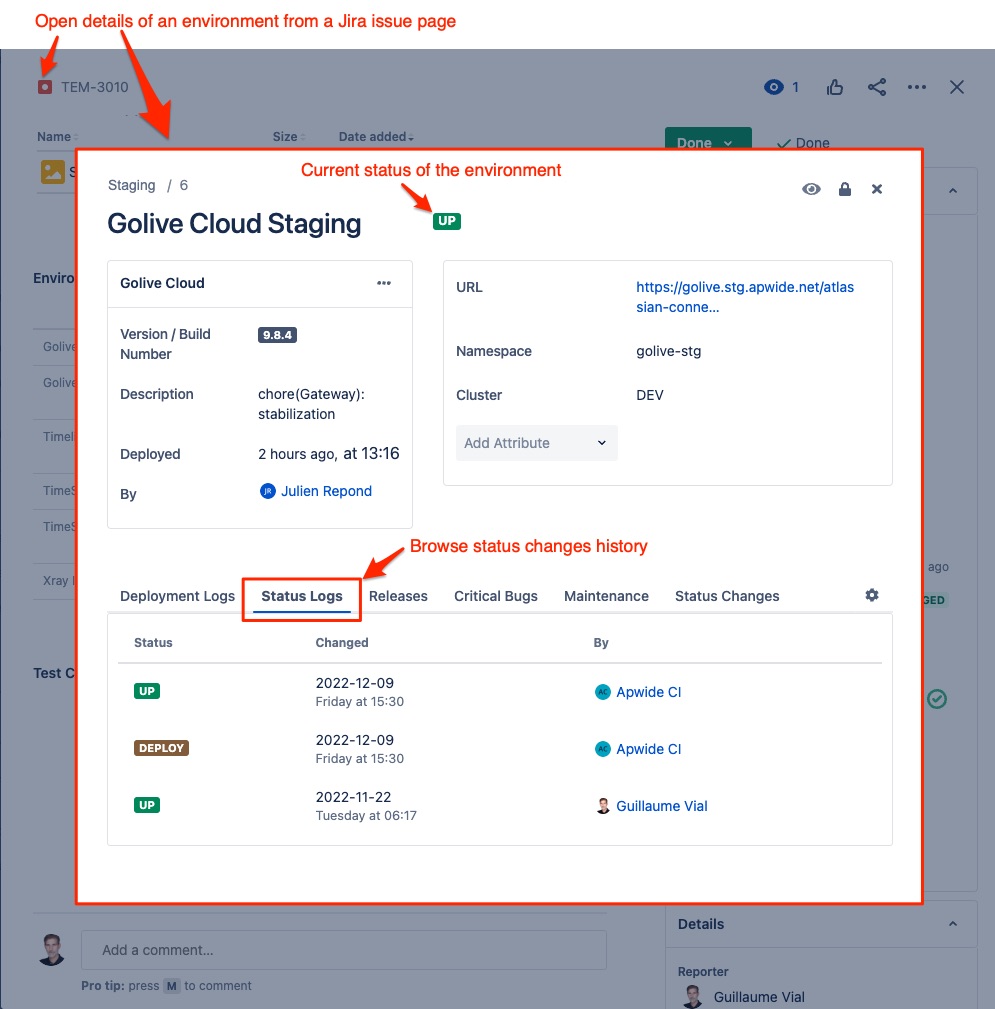
Last Status Changes view example:
Golive users can also individually choose to watch an environment in order to automatically receive email notification when the status of an environment is changed.
You can also use automations to send environment status changes information to Slack or Teams channels or any other destinations using custom webhooks.
What is the challenge?
Golive is good to communicate and to track statuses but it is not performing the monitoring of your environments by itself. The way to check if an environment is available, partially up and running or completely down depends on your SLA and the type of applications you deploy to your environments.
Update status information manually
One solution could be to update manually the status information in Golive when you know that an environment is down or has recovered. It is still better than nothing… but this manual process is error prone and does not scale when the number of apps and environments to monitor are increasing.
Use Liveness Probes
A much better “DevOps” solution is to put in place a “Liveness” probe for each of your environments. Here are the steps you have to perform to setup a probe for an environment:
Step 1 Choose an url you can call through http to check if your environment is up and running
Step 2 Prepare a job that do the following:
-
call the environment url
-
if response is an http error: set the environment status to “Down”
-
if response is ok: set the environment status to “Up”
Step 3 Schedule automatic execution of the job at a given frequency (ex: every 5 minutes)
To sum it up, a Liveness probe is composed of this following components:
-
probe url (specific to the application/environment that need to be monitored)
-
job
-
job scheduler
Most of the time, you should be able to re-use your favorite tools and technologies in order to implements such probes, let discover some practical examples in the following sections.
Use your CI/CD platform to execute Liveness Probes
You can easily use the CI/CD platform like Jenkins, Gitlab, Bitbucket pipelines,… to implements liveness probes for your testing environments. These tools are very easy to use to make http calls and handle responses. They usually include also the possibility to schedule execution of jobs at a given period. These tools are also providing very useful execution logs that are gold to investigate in case of errors.
This solution is also be very cheap to implement. It should not have big impact on current costs of your CI/CD chain.
For Jenkins, we even provides a Jenkins Shared Lib that highly simplify the coding of pipelines interacting with Golive. We will use this lib in the following pipeline example.
Example: use Jenkins to update statuses of your environments
In this example you will learn how you can easily put in place a Jenkins pipeline that will automatically monitor a set of Golive Environments thanks to our integration with Jenkins.
Liveness Probe components:
-
probe url : we will simply re-use the url set in Golive Environments
-
job: jenkins pipeline job
-
job scheduler: jenkins
With the Apwide Jenkins Shared Lib
The following jenkins pipeline uses our Jenkins Shared Lib:
@Library('apwide-jenkins-shared-lib@develop') _

pipeline {
    agent any
    options {
        disableConcurrentBuilds()
        buildDiscarder(logRotator(numToKeepStr: '1'))
    }
    triggers {
        cron('*/10 * * * *') // triggered every 10 minutes
    }
    environment {
        // check jenkins shared lib documentation to configure credentials
        APW_GOLIVE_CLOUD_CREDENTIALS_ID = 'golive-cloud-api-token'

        APW_UNAVAILABLE_STATUS = 'Down' // adapt to your own status name
        APW_AVAILABLE_STATUS = 'Up' // adapt to your own status name
    }
    stages {
        stage('Golive Environments Monitoring') {
            steps {
                // check the url of all golive environments for application "e-Com"
                apwCheckEnvironmentsStatus application:'e-Com'
                // check the url of all golive environments for application "ERP"
                apwCheckEnvironmentsStatus application:'ERP'
            }
        }
    }
}
Other more advanced examples of useful Jenkins pipelines to monitor your environments can be found here: https://github.com/apwide/apwide-jenkins-shared-lib/tree/master/examples/monitoring
Use other CI/CD or automation platforms
You can easily implement basic monitoring of your environments using curl to check url and to update Golive environments using the Golive Rest API. Every tools supporting http communication and including a scheduler can be used to build liveness probes to automatically update Golive environment statuses.
You can inspire yourselves from the example of Jenkins pipeline using curl and shell commands in the previous section.
Use a custom Linux cron job with curl
The Jenkins Shared Lib is using the Golive Rest API behind the scene. You can write your own unix script using curl to call the probe url and the Golive Rest API. You can then schedule automatic execution of this script using a cron.
Golive Monitor provides an example of bash script your can adapt to write your own.
Use Golive Monitor
You can use the Golive Monitor tool (bash script or docker).
Use Golive Monitor for automatically updating the statuses of your Golive Environments (health check). Free open-source tool with use cases and examples for a smooth integration.Use Observability & Synthetic Monitoring tools
Monitoring and “Observability” tools are widely used by organizations providing performant and resilient IT services to their end users. These solutions are highly recommended to quickly detect and fix degraded performance or system failures. They provide so called Synthetic Monitoring and/or Real User Monitoring (RUM) tools that can be used to implement high fidelity liveness probes for Golive environments.
We provide a few step by step guides to integration such tools with Golive:
New Relic
Connect Jira to New Relic Synthetic Monitoring for automatically updating the statuses of your Golive Environments. Use cases and examples for a smooth integration.
TUTORIAL Learn how to configure New Relic in order to automatically update the status of Golive environments when an issue is opened or closed by New Relic here: New Relic
Datadog
Connect Jira to Datadog Synthetic Monitoring for automatically updating the statuses of your Golive Environments. Use cases and examples for a smooth integration.
TUTORIAL Learn how to configure Datadog in order to automatically update the status of Golive environments when an alert or a recovery event is raised by Datadog here: Datadog
An endpoint dedicated to integrate with any monitoring tool
Golive provide a very handy endpoint to integrate with any of Observability and Synthetic monitoring tools not listed above. You can also easily integrate Golive with your “home made” monitoring tools and scripts using the following endpoint:
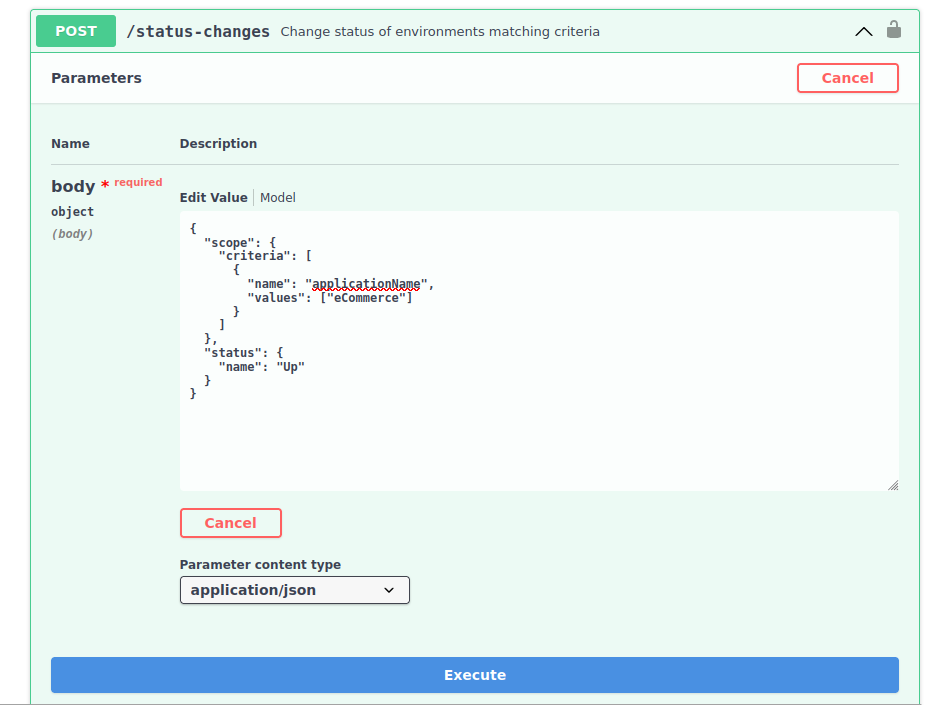
The endpoint allows bulk updates of the status of your Golive environments. It is part of the Golive Rest API. Learn more about to integrate this API here: Rest API
Which Solution should you choose?
As you have read, there are many different way to implement Liveness probes for your Golive environments. Here are some elements that should help you to choose the best solution in your context:
For Production Environments
Prefer an integration with a real monitoring tool like New Relic, Datadog, Dynatrace,… It will be more resilient and these tools includes rules and even sometimes IA to reduce the number of false alerts and avoid duplication of incidents. They provide tons of useful tools to investigate and fix performance issues and to detect problems announcing that your PROD start starving…
For Non-Production Environments
If you have the money and the possibility to use the same monitoring tools as for your prod: re-use these tools for your testing environments! 😉 .
Most of the cloud based tools provide solutions to put in place synthetic monitoring of environments that are not visible on the Internet.
If re-using the “prod” tools is not possible for economical, organizational or historical reasons you can opt for these alternatives in following order (rule of thumb):
-
Golive Monitor
-
New Relic: there is currently a “free forever” plan including Synthetic monitoring that may be enough to monitor all your non production environments
-
Jenkins platform, if already in place
-
other CI/CD platform, if already in place
-
Shell script scheduled by a cron job (if you love Linux and have access to a Linux machine)
-
Powershell script in a scheduled task (if you are forced to use Windows)
-
write Jira Automations rules (if your Jira instance can reach urls of your environments)
-
use a SaaS automation tool like Zapier (if you can afford it and do not like writing scripts)