
Learn how to use New Relic to automatically keep status of your Golive environments up to date
Integrate Golive with New Relic Synthetic Monitoring
New Relic Synthetic Monitoring allows to easily check availability of your applications.
Learn more: https://docs.newrelic.com/docs/synthetics/synthetic-monitoring/getting-started/get-started-synthetic-monitoring/
If you do not have an existing New Relic account, you can easily create a free account to perform this tutorial: https://newrelic.com/signup
In this section, you will learn how to configure New Relic in order to automatically update the status of Golive environments when an incident is detected or resolved on New Relic applications.
Connect New Relic with Golive API
New Relic will be the master system in charge to notify Golive when an environment is up or down. In order to do that, we must setup a connection between New Relic and the Golive Rest API. This connection will be used to update status of the Golive environments that are monitored by New Relic.
Step 1 Create a new Webhook destination
Go to “Alerts & AI” section and select “Destinations” sub-menu:
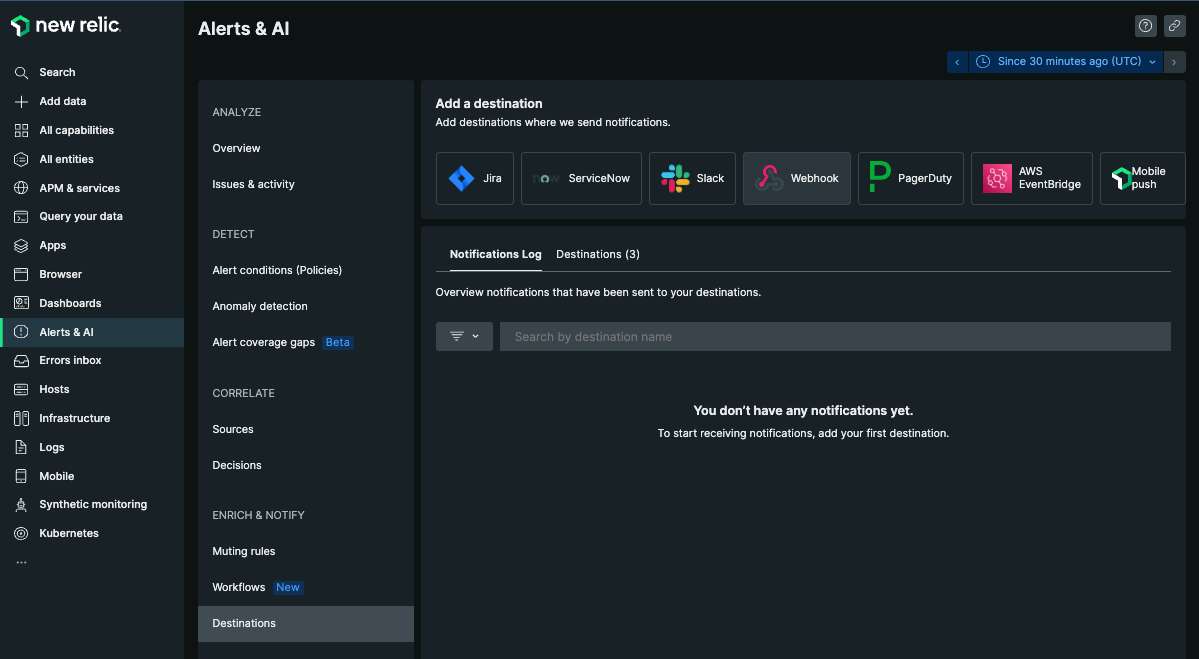
Click on “Webhook” to start configuring a new destination to interact with Golive
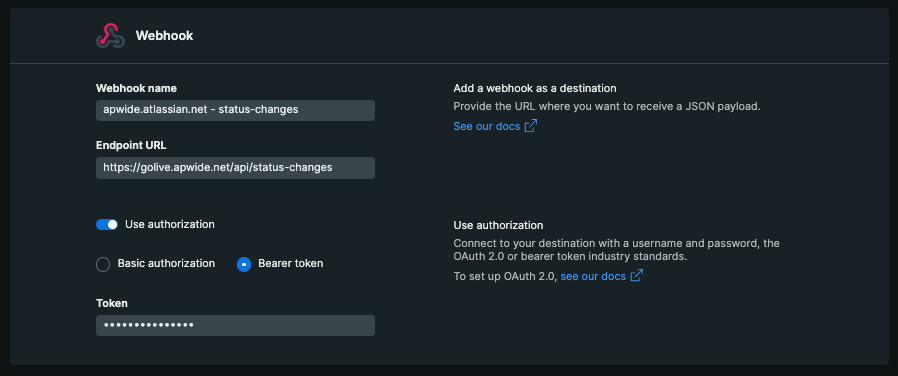
Step 2 Setup the Golive endpoint
-
choose an explicit name for the destination, for example: “your-site-name.atlassian.net - status-changes“
-
set this url as endpoint:
https://golive.apwide.net/api/status-changes -
activate “Use authorization” toggle
-
choose “Bearer token”
-
generate a new Golive API token and paste it in “Token” field
Step 3 Save the destination
Do not forget to save your settings by clicking “Save destination”
This destination can now be used by different New Relic alerts
Configure Golive Notifications
Step 1 Create a new Alert Policy
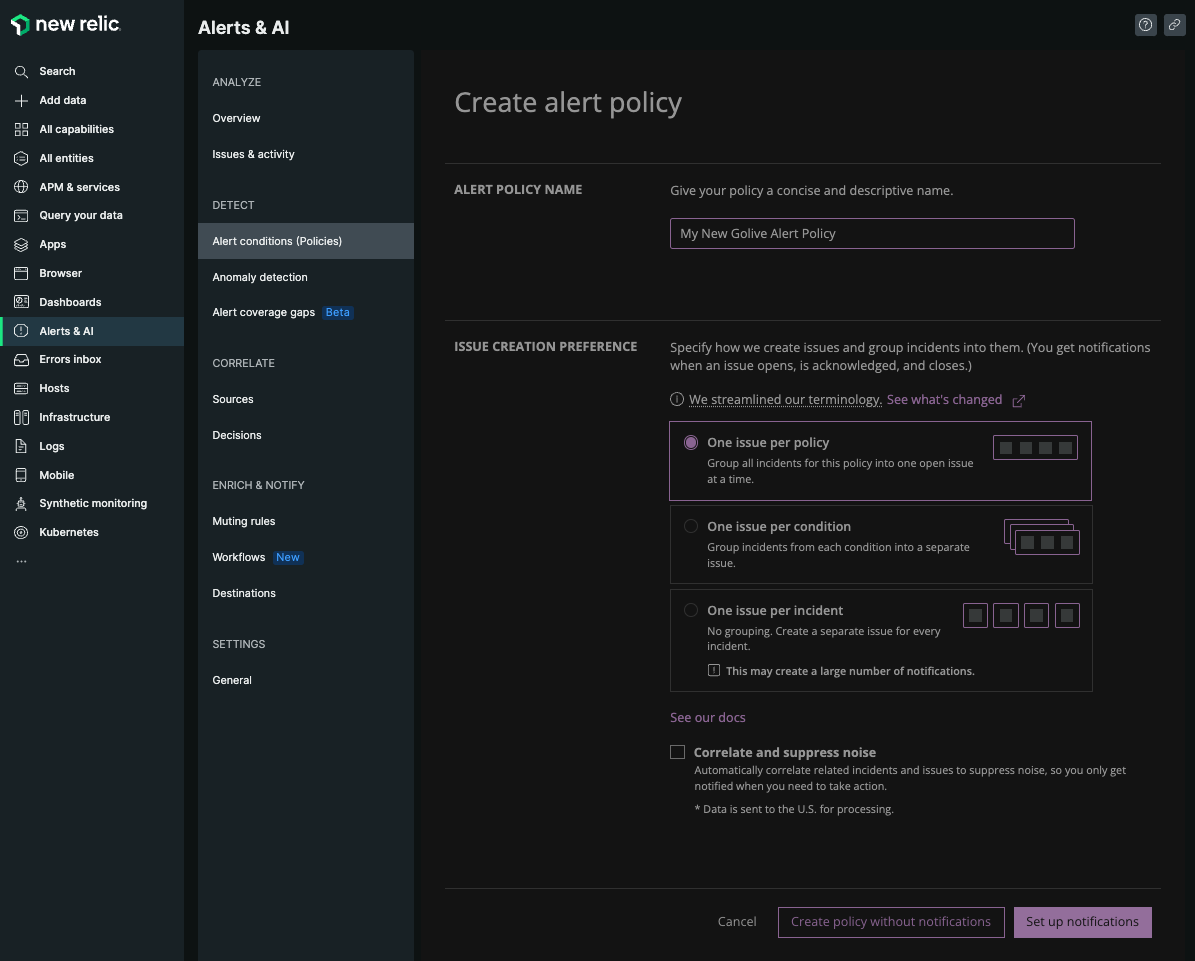
Go to “Alerts & AI” section and create a new “alert policy”:
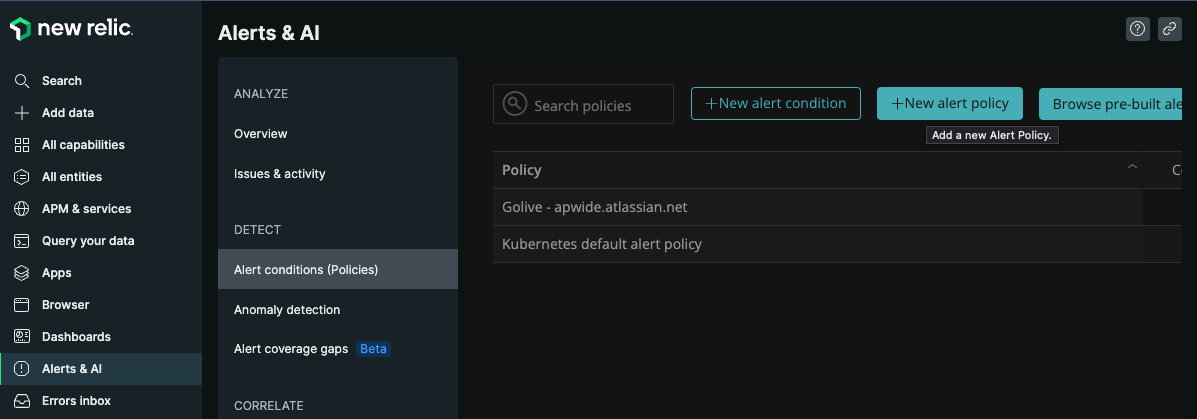
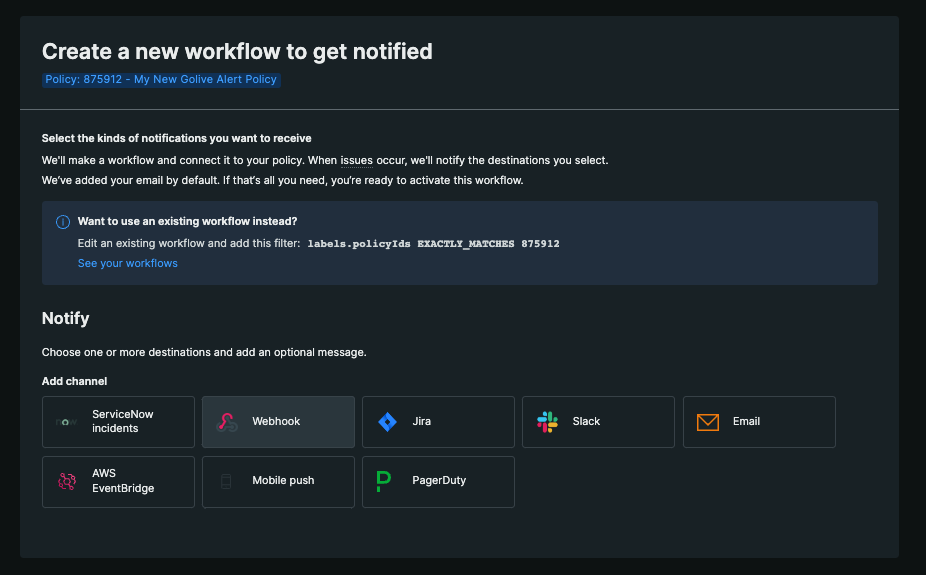
Choose a name and click “Set up notifications”
Click on Webhook:
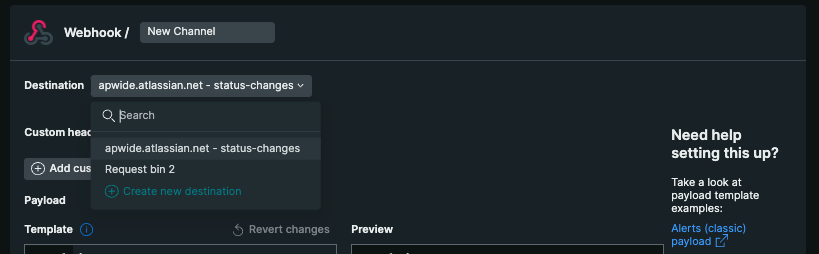
step 2 Configure the Webhook Notification
Select the “Destination” that you have just created:
Replace the default value of the “Template” field by the following code snippet:
{
  "scope": {
    "criteria": [
      {
        "name": "environmentId",
        "values": {{json accumulations.tag.apwEnvId}}
      }
    ]
  },
  "status": {
    "name": "{{#if (eq state "CLOSED")}}Up{{/if}}{{#if (eq state "ACTIVATED")}}Down{{/if}}"
  }
}
Ensure that these 2 environment statuses exist in Golive:
-
“Up”
-
“Down”
Or replace “Up” and “Down” in the code snippet by your custom statuses.
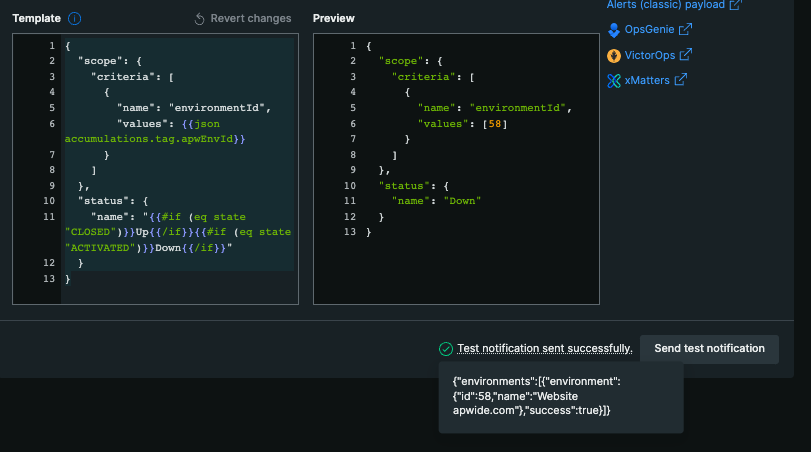
You should get something like that:
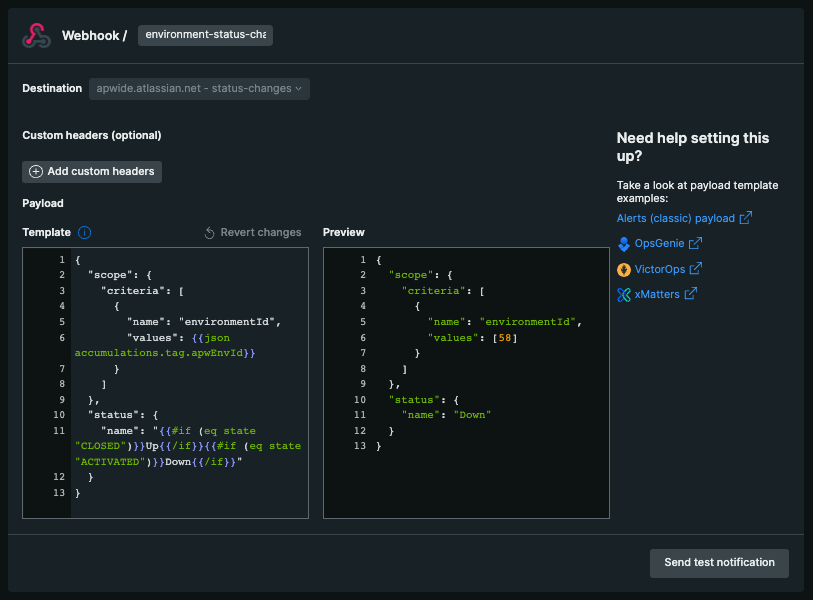
If you have not configured and tagged the synthetic monitoring, the preview won’t correctly substitute the placeholder {{json accumulations.tag.apwEnvId}}, replacing it instead with N/A.
To test the connection, replace the placeholder with a hard-coded, valid environment ID set as a JSON array, as shown in the preview.
step 3 Test the Webhook Notification
In “Preview” tab, ensure that the environment id is correct on line 6, in field “values”.
If it is correct, click on “Send test notification” in order to check that everything is ok.
You can view error or success response by pointing your mouse over the text summary:
Configure a monitor per Environment
Step 1 Create a new Golive Environment and get its ID
Connect to Golive and create a new Golive environment that you will use to test this integration.
Learn how to create a new environment here: Clone and Delete Environments
Memorize the id of the environment that you want to use to test this integration.
In current example, the id of this environment is 28.
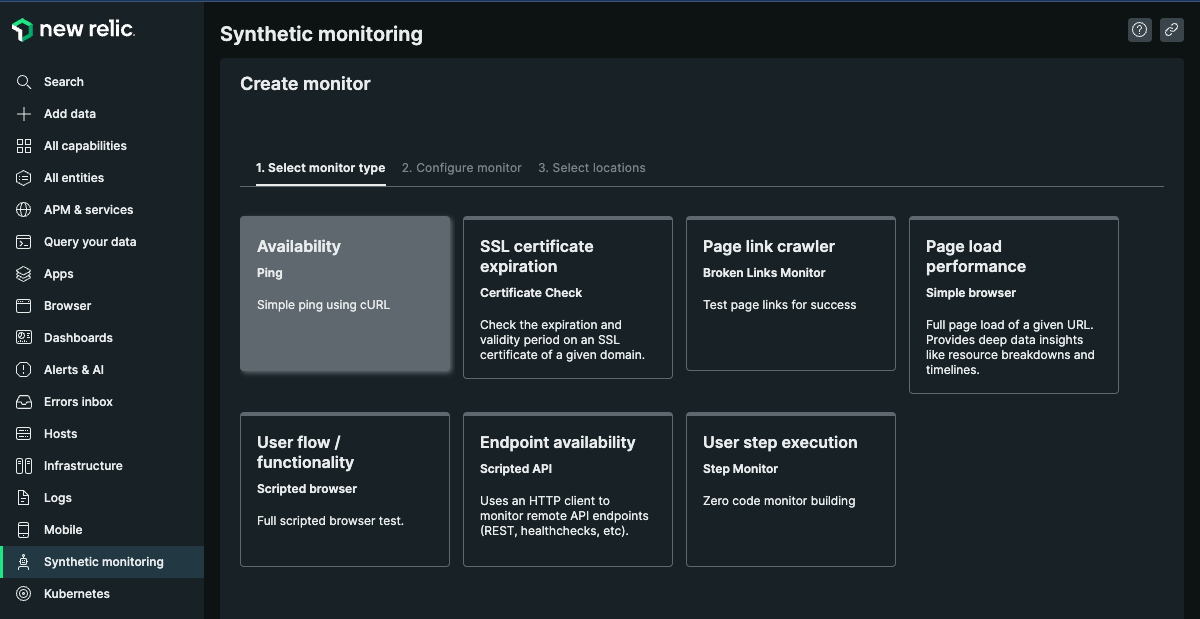
Step 2 Create a new Monitor
Connect to New Relic and start to create a new Monitor in “Synthetic monitoring” section and choose the “Availability” monitor:
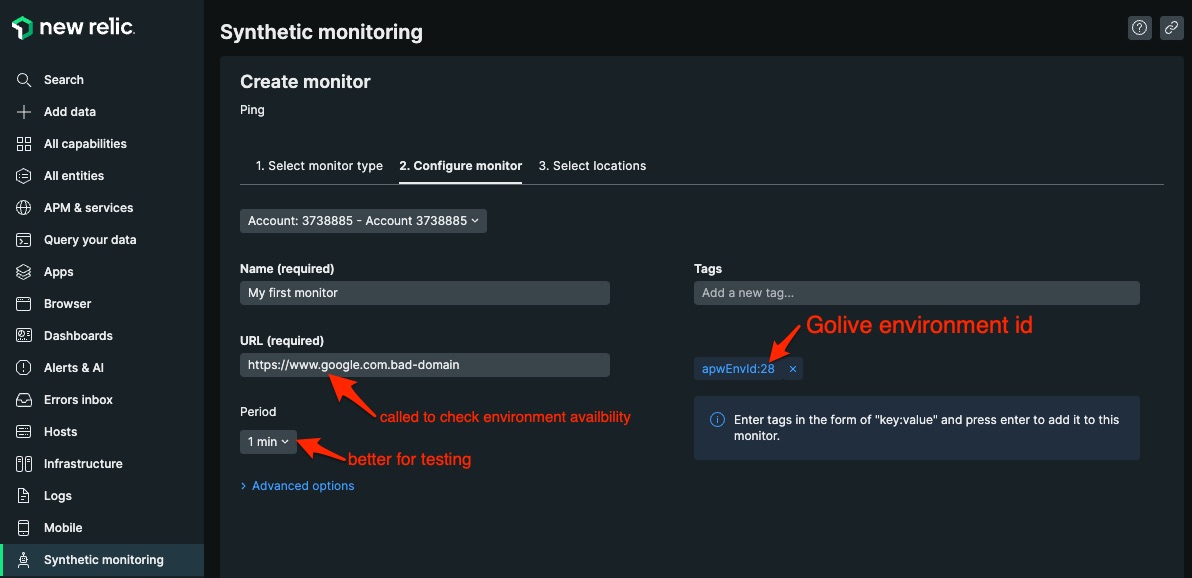
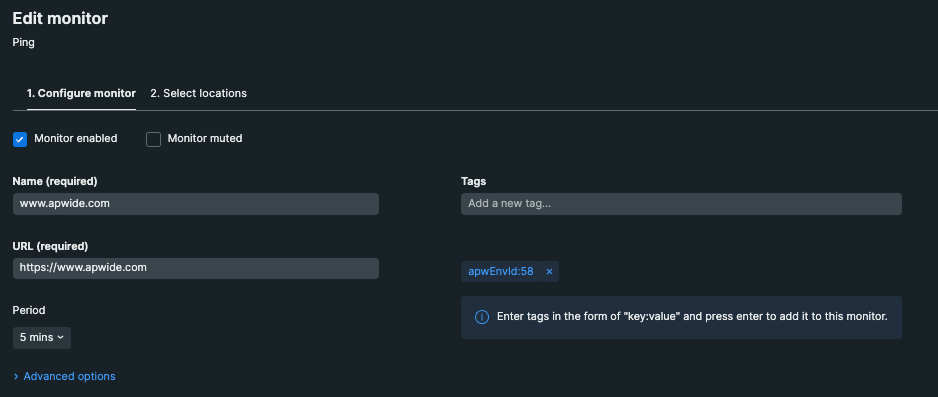
Step 3 Tag your new Monitor with id of the corresponding Golive Environment
You must add a tag called “apwEnvId” containing the id of the Golive environment that is monitored
Ex: apwEnvId:28 (without space, where 28 should be replaced by your own Golive environment id):
Important
Add tag with accurate value at this step, while creating the monitor. Tags updated or created after the creation of the monitor will not be transmitted to alerts and webhook notifications! (bug in New Relic at the time we write this documentation).
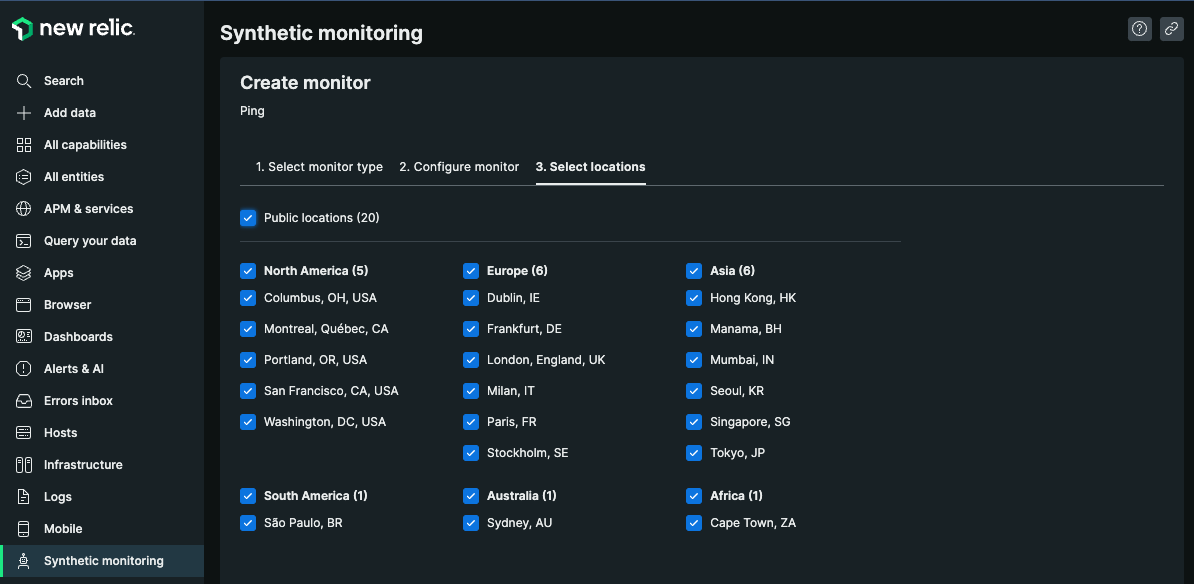
Step 4 Select locations and save the monitor
Step 5 Add the monitor to the Golive alert policy
The monitor must be added to the Golive alert policy previously created in order to alert Golive when an issue is detected or resolved.
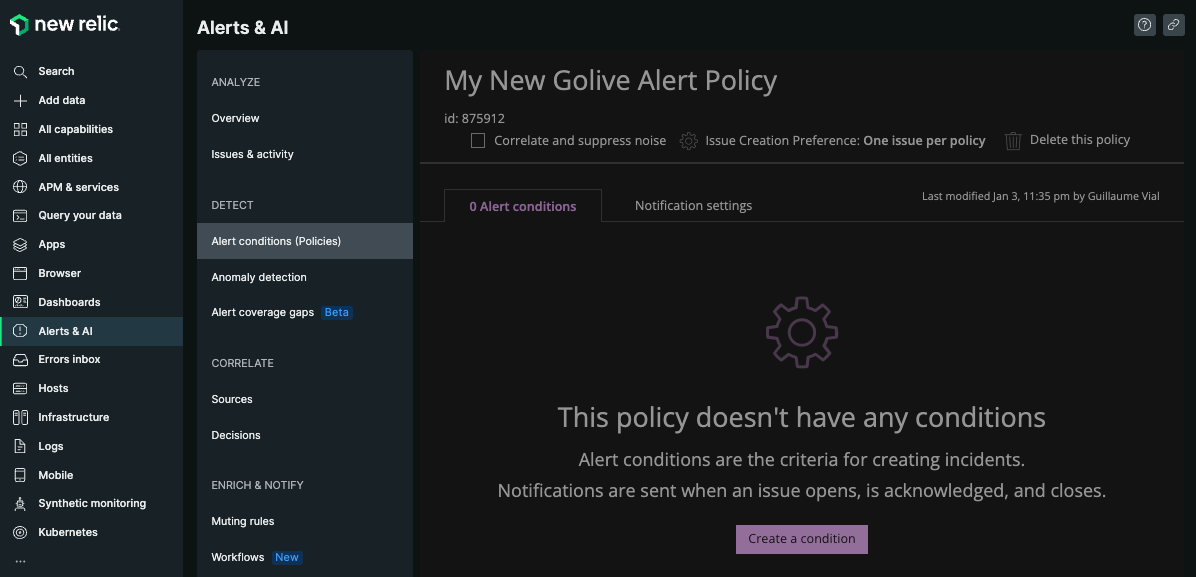
Click on the Golive alert policy:
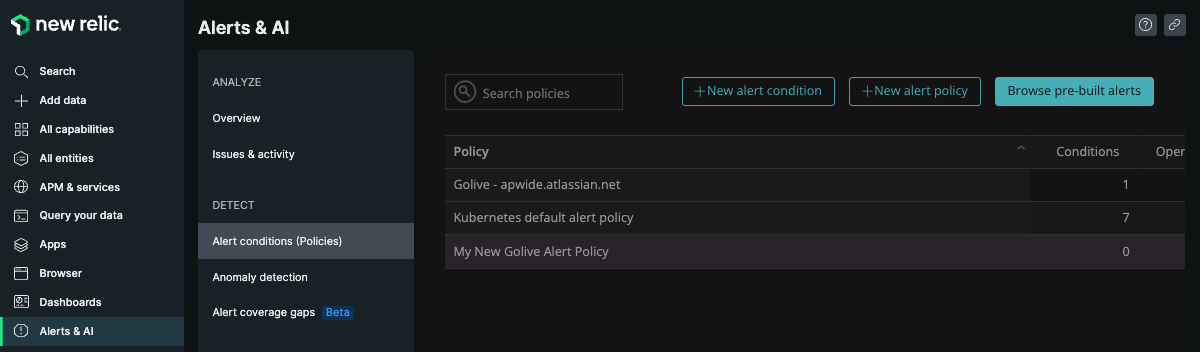
Click on “Create a condition”:
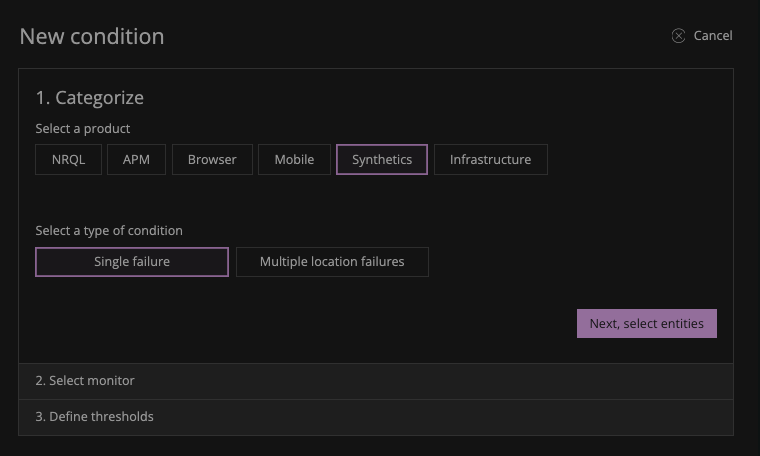
Click on “Synthetics”, “Single failure” and “Next, select entities”:
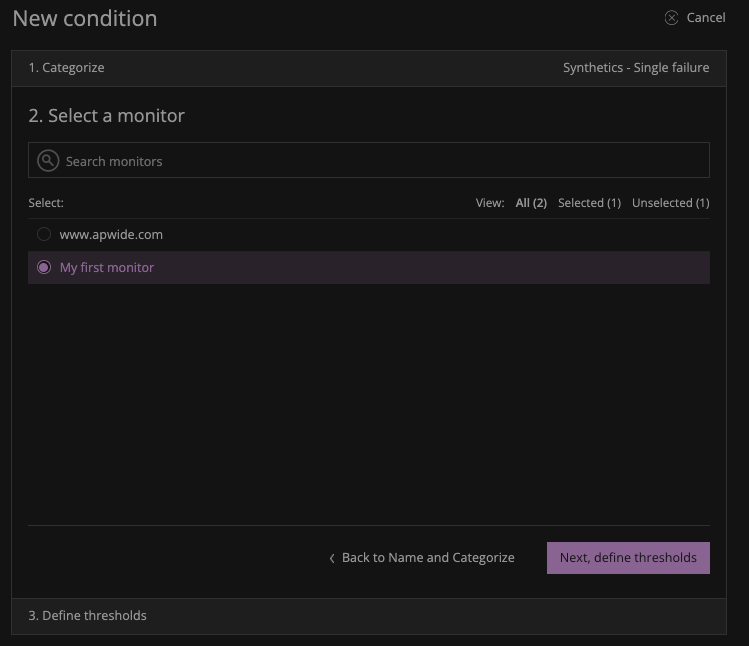
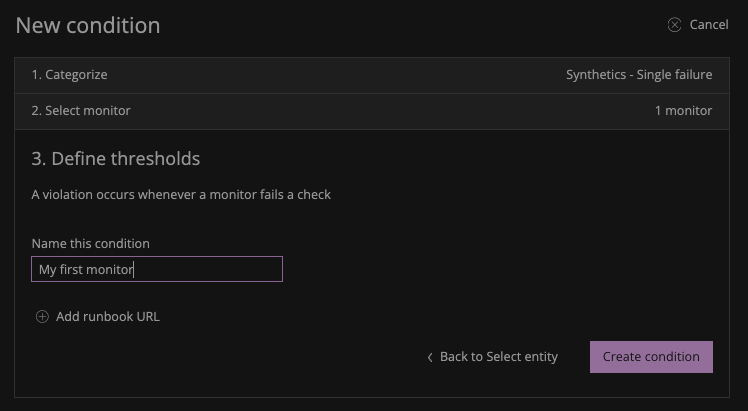
Select the monitor that you have just created and click on “Next, define thresholds”:
Choose a name for this condition (you can re-use the name of the monitor) and click on “Create condition”:
You have configured your first Monitor connected with Golive!
You can repeat these steps to create a monitor for each of your Golive Environments.
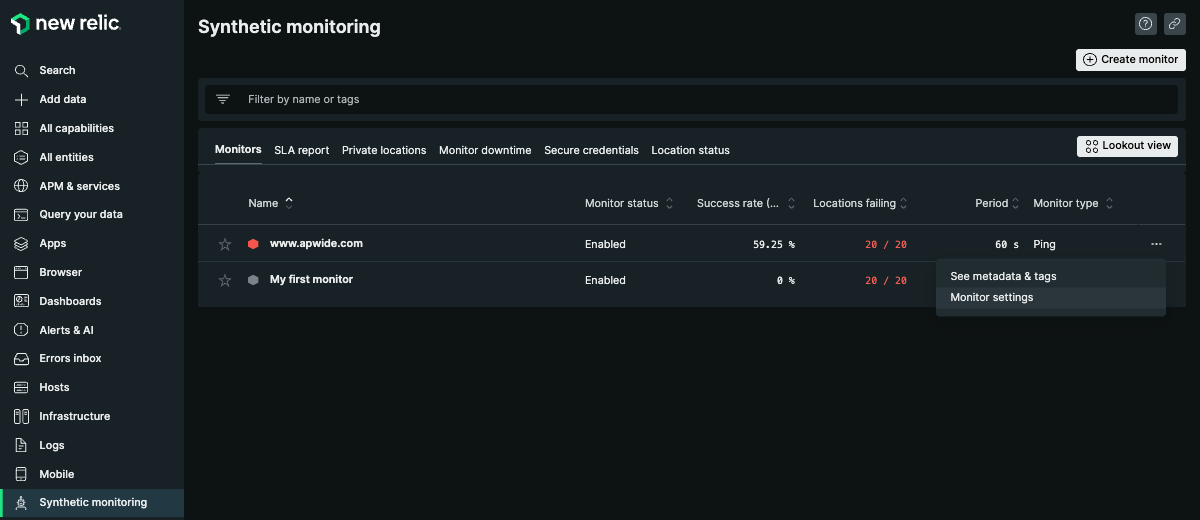
Test your Monitors
Select “Monitor settings” in menu of the monitor your want to test:
Replace the right URL by a fake one:
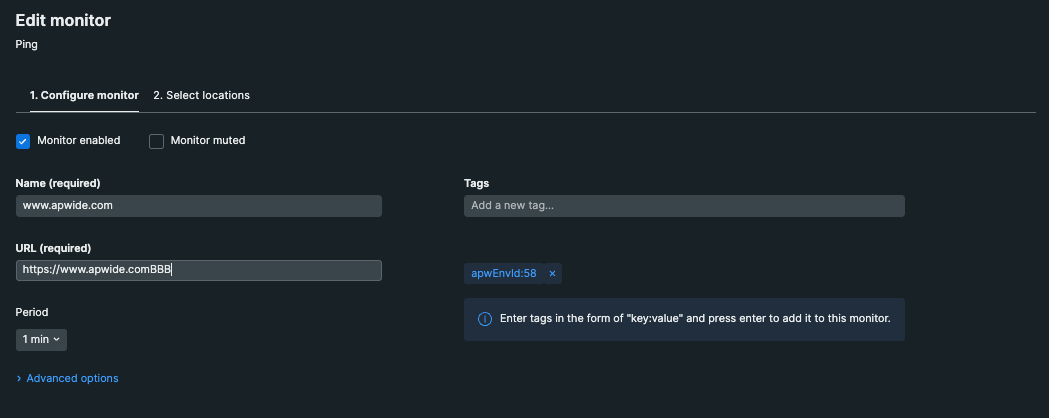
Ensure that the period is set to 1 minute to reduce testing time
Wait 1 minute and open the “Notifications Log”:
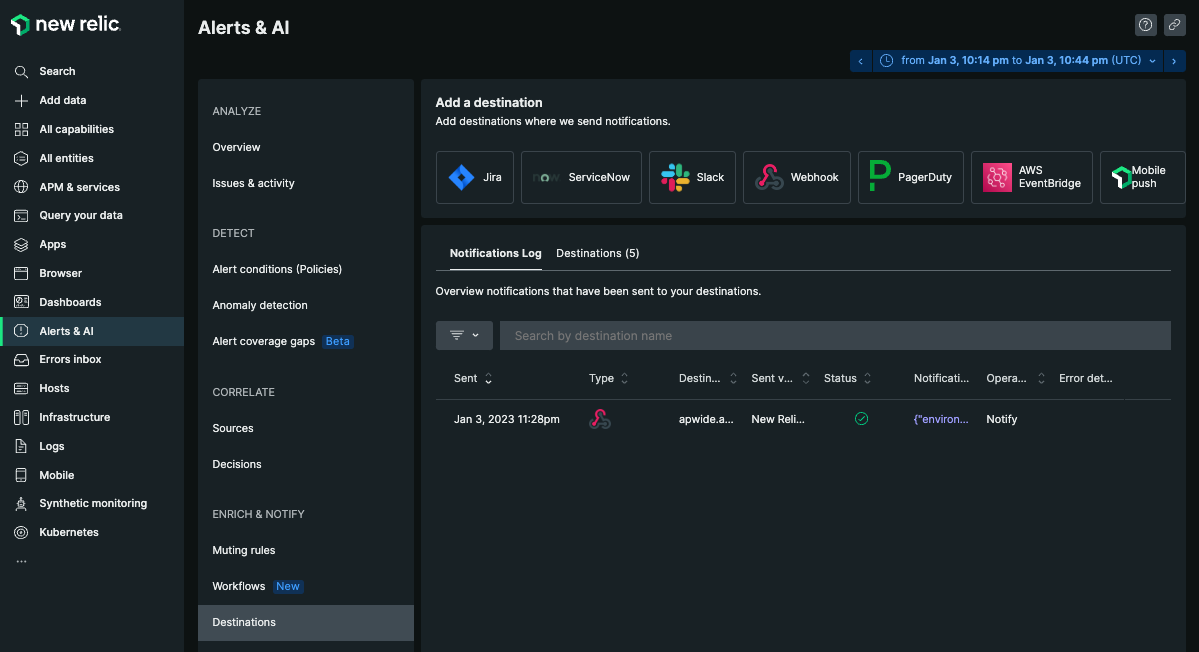
You can check the status of the notifications that was sent to Golive in the table.
If the message was successfully sent, check that the status of your environment has been changed in Golive.
Put back the right URL and the right period:
After a while, re-open the “Notifications Log” to check that messages are properly sent to Golive and that the status of your environments have been updated accordingly in Golive.