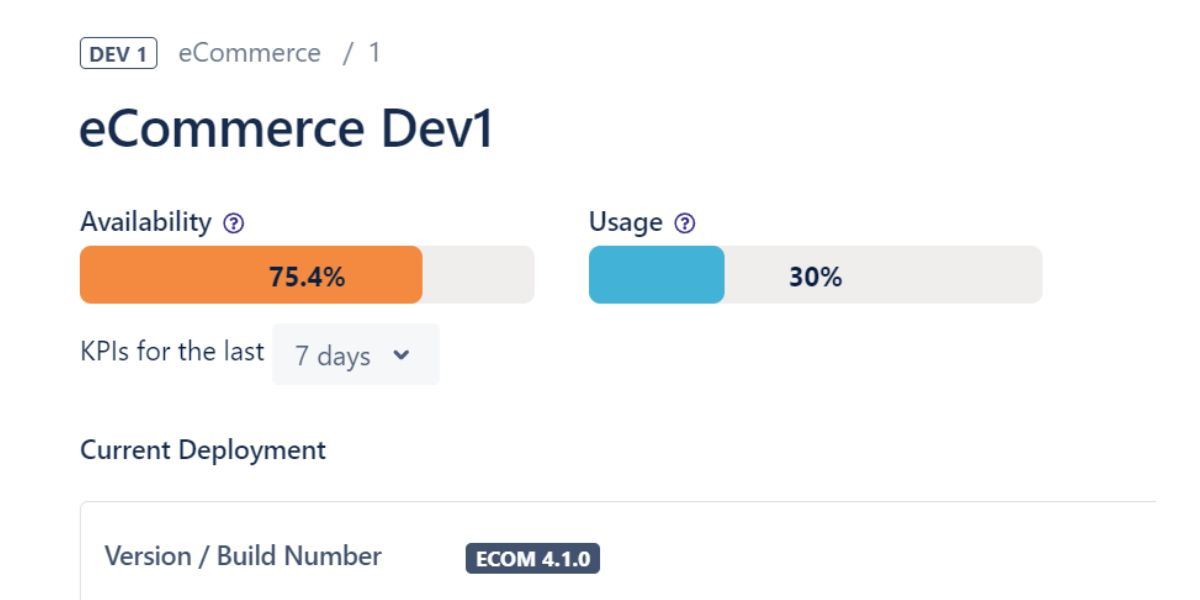
Environment KPIs
This guide provides an overview of the Environment Availability and Environment Usage metrics. These KPIs help assess Environment performance and utilization over specific time periods. In the drop-down, you can view KPIs for the past 24 hours, 7 days, 14 days, 30 days, etc.

Access Points for KPIs
These KPIs can be viewed in the following locations:
Environment Availability
Environment Availability reflects the percentage of time an Environment was fully operational (no outages) over a set period. For example, if the "eCommerce Staging" Environment was available 99% of the time in the last 30 days, it indicates strong reliability.
How It’s Calculated
The percentage is based on the time the Environment was marked Available versus the total time it could have been operational. Available status is used for any period when the Environment functioned normally, while all other statuses indicate outages.
Status Mapping
Available: Indicates the Environment was functioning normally. It may include statuses like
Up,Slow, andAvailable.Unavailable: Includes any status representing downtime. It may include statuses like
Down,In deployment, andUnavailable.
To calculate and determine the availability of your Environments, Golive uses the status types defined in the Environment Statuses page.
Environment Usage
Environment Usage represents the percentage of time an environment was actively used (or scheduled for use) within a period. For instance, if the "eCommerce Staging" environment was used 60% of the time in the last 30 days, it suggests moderate utilization.
How It’s Calculated
Usage is measured by the time the environment has scheduled events, versus the total available time, excluding blackout periods. Scheduled events duration includes all bookings and changes events, counting the Environment whether it serves as primary or a dependency.
Info
Overlapping bookings and changes events, such as two simultaneous scheduled events, are counted once to avoid duplication.
